Using SVG vs. Canvas: A short guide
So, you need to add some charts to your app or site? By now you’ve figured out that there are many different ways to accomplish this, most of which utilize one of two primary technologies: SVG and the Canvas API.
In order to decide which will best fit your needs, we need to look at SVG’s and Canvas’ relative strengths and weaknesses and how those play into the different chart-drawing solutions available.
Canvas and SVG are both technologies that allow web developers to draw images onto the screen, but they have very different APIs and approaches to doing so.
What is SVG?
SVG stands for “scalable vector graphics” and represents a body of standards for declaratively defining the properties of an image (things like the shapes themselves, fill color, stroke color, and the like).
<svg width="100" height="100" xmlns="http://www.w3.org/2000/svg">
  <circle cx="50" cy="50" r="45" fill="#FFA69E" />
</svg>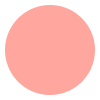
SVG images are created either inline with HTML code by adding an <svg> tag, or can be defined in separate files (with the .svg extension) and referenced in the HTML.
What is Canvas?
Canvas is a lower-level browser standard API that allows developers to imperatively “draw” directly onto the image by issuing a series of commands:
const canvas = document.querySelector('canvas');
const ctx = canvas.getContext('2d');
ctx.fillStyle = '#FFA69E';
ctx.arc(50, 50, 45, 0, 2 * Math.PI);
ctx.fill();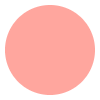
Canvas images are created by adding a <canvas> element to the HTML and then manipulating that element via the JavaScript DOM API as shown above.
SVG vs. Canvas: API differences
Because Canvas is a lower level API than SVG, it offers more flexibility than SVG in exchange for greater complexity. The limit of what can be drawn on a Canvas is only limited by how much code a developer is willing to write. Any SVG image can be drawn with the Canvas API with enough effort.
Conversely, because SVG is a higher level API compared to Canvas, it can create complex images without requiring developers to write complicated code.
In this example, we apply lighting and blur effects to a couple of polygons in just 15 lines of SVG code. The corresponding Canvas code would be much more complex to produce the same image:
<svg width="200" height="200" xmlns="http://www.w3.org/2000/svg">
  <defs>
    <filter id="point-light">
      <feSpecularLighting result="light" specularConstant="1" specularExponent="150" lighting-color="#DDFFF7">
        <fePointLight x="100" y="100" z="200"/>
      </feSpecularLighting>
      <feComposite in="SourceGraphic" in2="light" operator="lighter" />
    </filter>
    <filter id="blur">
      <feGaussianBlur in="SourceGraphic" stdDeviation="3" />
    </filter>
  </defs>
  <polygon points="190,10 10,55 10,190" fill="#AA4465" filter="url(#point-light)"/>
  <polygon points="10,10 190,100 100,190 100,10" fill="#FFA69E" filter="url(#blur)" />
</svg>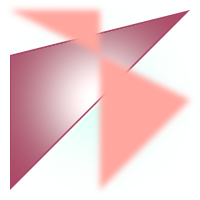
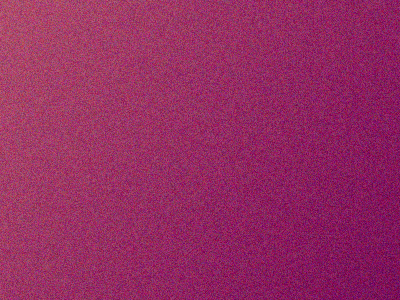
However, because Canvas offers more flexibility, not every image that can be drawn on a Canvas can be precisely expressed with SVG syntax (short of using tiny SVG <rect> elements as “pixels”).
This image would be somewhat more difficult to produce using SVG:
const canvas = document.querySelector('canvas');
const ctx = canvas.getContext('2d');
function mix(channel1, channel2, proportion, variability) {
  const scaledVariability = variability * 0xFF;
  return channel1 * (1 - proportion) +
    channel2 * proportion -
    scaledVariability / 2 +
    scaledVariability * Math.random();
}
const color1 = {
  r: 0xAA,
  g: 0x44,
  b: 0x65,
};
const color2 = {
  r: 0x86,
  g: 0x16,
  b: 0x57,
};
const variability = 0.2;
for (x = 0; x < Canvas.width; x++) {
  for (y = 0; y < Canvas.height; y++) {
    const proportion = x / (Canvas.width - 1) +
      y / (Canvas.height - 1) / 2;
    const color = {
      r: mix(color1.r, color2.r, proportion, variability),
      g: mix(color1.g, color2.g, proportion, variability),
      b: mix(color1.b, color2.b, proportion, variability),
      a: (0.9 + Math.random() / 10).toFixed(2),
    };
    ctx.fillStyle = `rgba(${color.r}, ${color.g}, ${color.b}, ${color.a})`;
    ctx.fillRect(x, y, 1, 1);
  }
}
Important implications to consider when using SVG vs. Canvas
The fundamental differences in API between SVG and Canvas outlined above have downstream effects that you should consider, such as the following.
SVG elements can exist in the DOM alongside the HTML markup
This means that SVG DOM elements can be manipulated in ways that are familiar to web developers, including being integrated into popular frameworks like React or Vue.
One downside of this is that complex SVG charts containing tens of thousands of nodes, for example, could prove to be too resource-intensive for browsers to render efficiently, leading to sluggish or janky web pages. This is because Canvas operations are committed directly to the screen, so the number of drawing operations is less impactful to performance in that there is no overhead of keeping track of these operations in the DOM.
As with HTML, SVG is declarative
This means that the browser takes care of translating the desired image into the low-level imperative code for drawing pixels onto the screen — the developer doesn’t have to worry about that. Complex images can be succinctly represented in SVG syntax.
SVG images can be responsive, and Canvas images are not
SVGs can grow and shrink in response to parent container sizes or screen size changes, whereas Canvas elements need custom JavaScript to achieve this behavior.
SVG vs. Canvas: Which is better for you?
With the differences between SVG and Canvas in mind, we can evaluate the needs of our chart project and determine which technology might better serve us. It’s worth asking the following:
- Will the charts have many elements or be highly detailed? Canvas may perform better for showing this data without bogging down the browser with many DOM nodes. But if the charts are relatively simple, the SVG syntax may be a simpler and quicker solution to getting a nice-looking chart out the door quickly.
- Do your charts need to have several animations or be responsive in width? While it’s certainly possible to render animations using Canvas or to make Canvas elements respond to width changes, it may be more straightforward to achieve these effects using SVG and CSS.
- Do the charts need to be interactive? Because SVG elements are in the DOM, responding to user actions like clicks on particular elements of a chart is as simple as responding to events on any other DOM element. Canvas interactivity is possible but will require some additional code.
Charting libraries
Because rendering data visualizations is such a common use case for websites and applications, there are a plethora of libraries that make drawing charts with Canvas or SVG easy. A quick DuckDuckGo search of “JavaScript chart libraries” will bring up dozens of pages outlining many of the different options available.
Some popular options offer great-looking charts out of the box, such as Chart.js or Chartist. Others are more complex but allow for more customization, like Vega-Lite. Many libraries are built upon the de-facto library for data visualization on the web, D3.js, which offers complete flexibility and control at the expense of a steep learning curve.
Rendering charts on the backend
Creating charts with SVG and Canvas isn’t limited to browser contexts; they can be rendered in server applications as well.
For SVG, a tool like Puppeteer can be used to render SVG images in a headless Chrome browser and generate screenshots as desired. For Canvas, there is a fantastic library called Canvas that provides a near-complete implementation of the standard Canvas API for Node.js.
An example of a backend Canvas rendering
This JavaScript snippet encodes a secret message. To see what it is, save this code in a file called index.js:
const { join } = require('path'),
  { createWriteStream } = require('fs'),
  { createCanvas } = require('canvas');

const canvas = createCanvas(200, 100);
const ctx = canvas.getContext('2d');

ctx.strokeStyle = '#861657';
ctx.lineWidth = 5;
ctx.lineCap = 'round';
ctx.beginPath();
ctx.moveTo(40, 25);
ctx.lineTo(40, 75);
ctx.moveTo(40, 50);
ctx.lineTo(100, 50);
ctx.moveTo(100, 25);
ctx.lineTo(100, 75);
ctx.moveTo(160, 25);
ctx.lineTo(160, 75);
ctx.stroke();

const path = join(__dirname, 'message.png');
const out = createWriteStream(path);
const stream = Canvas.createPNGStream();
stream.pipe(out);
out.on('finish', () => console.log(`Image file created at ${path}.`));
Then save a file called package.json right next to index.js with the following content:
{
  "private": true,
  "dependencies": {
    "canvas": "^2.7.0"
  }
}
From the same directory where you saved index.js and package.json, run the following command (Node.js must installed available on your PATH):
npm install
node index.js
If everything went according to plan, your headlessly generated PNG image with secret message will be saved to message.png. 👋
Conclusion
SVG and Canvas are both powerful and mature technologies, each with a strong ecosystem of libraries and documentation to help bring your charts to life. And some libraries even support rendering to both SVG or Canvas!
Don’t be afraid to invest some time in evaluating alternatives to find the right solution for your specific project’s needs. Here are some quick rules of thumb when it comes to deciding on SVG or Canvas.
- Do your charts need to be responsive or interactive? SVG may offer these features more simply than Canvas.
- Will your charts be highly detailed or complex? Canvas may offer better performance and greater control than SVG.
Good luck!